Inserting elements in a map
Introduction
gvSIG can be used to add the following cartographic elements to a map:
- Views
- Images
- Scale bars
- Legends
- Graphic objects
- North
- Texts
- Boxes
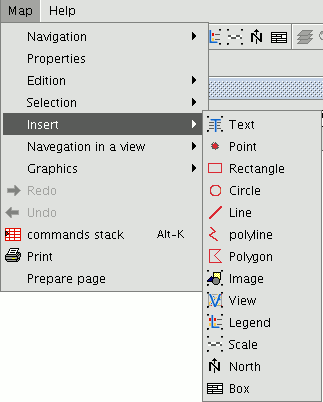
Many of these cartographic elements are closely linked to the “View” document, so that when changes are made in the view, they are shown in the map (changes in zooms, panning, legend modifications, layer organisation, etc.). You can access the different options from the tool bar or by going to the “Map” menu and then to “Insert”.
Legend
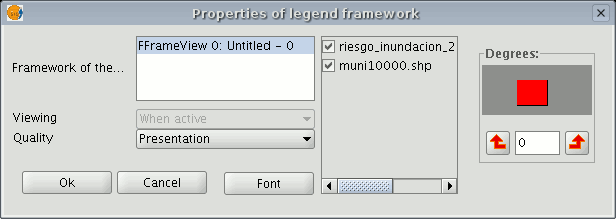
The legend represents the visible layers of the ToC in the selected view. If a legend is inserted, it is added in the same order as it appears in the ToC.

In the view frame, select the view the legend is associated with. The order in which the legends in the ToC will be added appears in the panel on the right.
Scale range
This tool allows you to insert a scale (associated with the view) in the map.

The scale bar dialogue box is shown below:
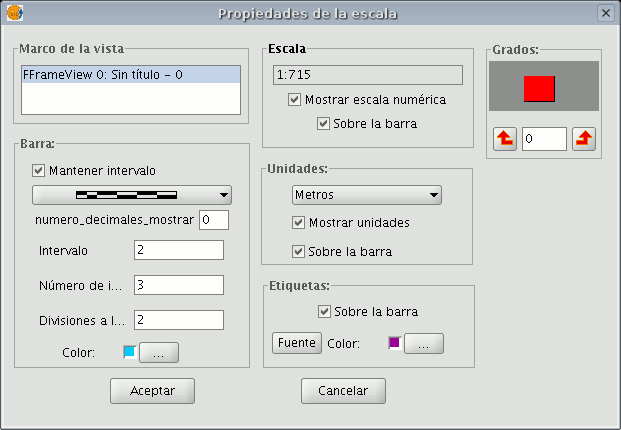
View frame: Select the view, if there is more than one, the inserted scale is related to.
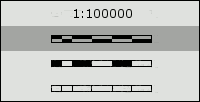
Bar: Select the type of scale you wish to insert (numeric or graphic). By clicking on the pull-down menu, you can see the different options with which the scale to be inserted in the map can be shown.
Intervals: Select the number of intervals, what each one represents and the number of divisions to the left of the 0 that you require in the interval.
Scale: You can use this section to make the numeric scale appear above the bar.
Units: This defines the graphic scale units of measurement (metres, Km., etc.).
Labels: You can use this box to select the label colour, font and location (numeric scale, units…).
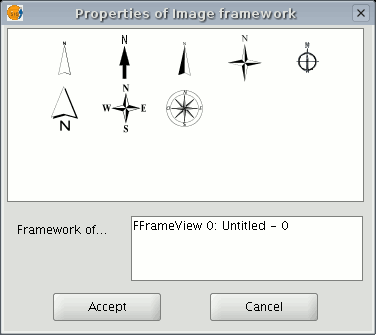
North symbol

If you click on the “Insert “North” button in the tool bar, you can insert a “North” symbol in the map. Place the mouse pointer on one of the vertexes of the rectangle which define the space to be occupied by the symbol, left click, then drag the pointer to the opposite vertexes and drop. A dialogue box appears in which you can choose between several default North symbols.
You can add new symbols by copying them in the folder:
bin/gvSIG/extensiones/com.iver.cit.gvsig/northimages
of the folder you have installed gvSIG in.
The acceptable format for North symbols is SVG (Scalable Vector Graphics). To add a new North symbol you will need to use an external application (such as Inkscape http://www.inkscape.org). Moreover, in order to ensure that the new North symbol will be correctly processed by gvSIG, it is better to base it on one of the default symbols suggested by gvSIG.
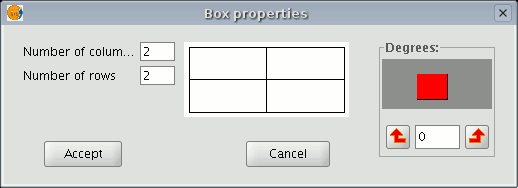
Box
gvSIG has a tool which allows you to insert a box in the map.
If you wish to insert a box, select the following button from the tool bar:

Left click on the map area you wish to insert the object in and drag it to create a frame which will define the future box size.
When you drop it, a window will automatically appear for you to define some of the box properties.
Image
You can use this tool to insert an image in the map.

You can access this tool by clicking on the “Insert image” button or by going to the “Map” menu bar, then to “Insert” and then to “Image”. If you activate this tool and create the frame to insert the image on the map (similar to “Insert view”), the following dialogue box will appear:
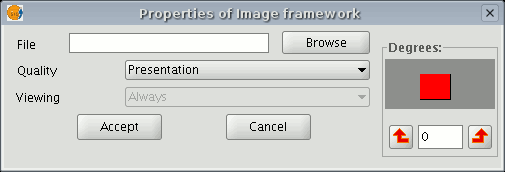
If you click on the “Browse” button, you can select the file path of the image to be inserted. You can insert an image in any of the following formats: jpeg, jpg, gif, png and bmp.
From gvSIG version 0.4 onwards, you can add vector files in SVG format to the map.
Views
Insert a view
You can insert a view in the map by clicking on the “Insert View” button in the tool bar.

Place the mouse pointer on one of the vertexes of the rectangle which define the view area, left click and drag the pointer to the opposite vertex and drop. A dialogue box appears in which you can define the view-type element properties you have just inserted.

View: You can use the text box to select the view you wish to insert, if there is more than one.
Active link: If this check box is enabled, any changes made in the view (changing colour, adding a layer…) will be shown in the map. Remember that scale changes will not be affected by this check box, because these modifications are regulated by the scale pull-down menu which appears below.
Scale: Select one of the following three scale types: Automatic: If this option is chosen, any scale change made in the view will automatically be shown on the map.
Keep visualisation scale: In this case, although you change the view frame in the map, the layer associated with the view will not resize itself and will keep the same size it has in the view.
User-defined: This option allows you to define a specific scale.
Quality: This defines the visualisation, as either presentation or draft quality.
Degrees: This allows you to specify a degree of rotation when the view is inserted in the map. This option also appears in the rest of the elements that can be inserted: images, scales, legends and texts.
Exploring the view of the map

There are several tools you can use to navigate around the view.

Zoom in: Enlarges a particular area of the view.

Zoom out: Reduces a particular area of the view.

Full extent: Full zoom of the total area included in all the layers of the view.

Panning: This allows you to change the view zoom by dragging the viewing field all over the view with the mouse. Click and hold down the left button of the mouse then move the mouse in the direction you require.
Texts

Texts, which can also be inserted by clicking on the corresponding button in the tool bar or by selecting “Maps” then “Insert” and then “Text”, are defined in the following dialogue box.
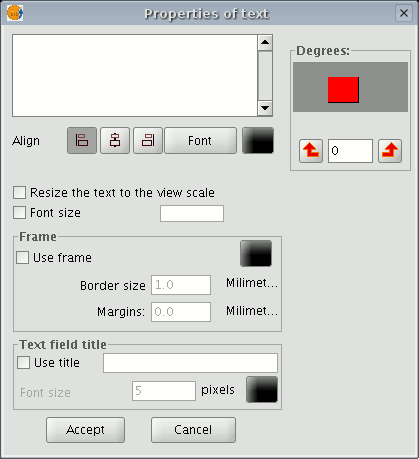
You can write the text you wish to appear in the map in the text box.
Align: This can be used to select the alignment type (left, centred or right respectively).
Font: This can be used to select the font type. You can also set the font size by activating the corresponding check box and specifying the required size in the text box.
Degrees: This defines the text slope, from the horizontal axis.
Frame: This allows you to define a border around the text you are using.
Text field title: You can also define a title for the corresponding border.
Graphics
Insert graphic elements
You can insert the following types of graphic elements:
- Points
- Rectangles
- Circles
- Lines
- Polylines
- Polygons
All these elements can be inserted by going to “Insert” in the “Map” menu or by clicking on the corresponding button in the tool bar.
If you wish to insert a graphic element, left click on the map in the place you wish the graphic element to be inserted in.
Editing graphic elements in a map
When you have inserted a graphic element, you can edit its vertexes. You can access this tool by going to the "Map" menu, then to "Edit" and then to “Edit vertexes” or from the following tool bar button.
If you wish to edit a vertex in a graphic element, select the element from the map and go to the tool.
-----------------------------------
- Se ha producido un error en el documento Insert graphic elements , accediendo a la imagen menuMapaInsertar_en.png, que probablemente no existe. Se han encontrado las siguientas alternativas [1, 2, ]
- Se ha producido un error en el documento Editing graphic elements in a map , accediendo a la imagen botonEditarVertices_es.png, que probablemente no existe. Se han encontrado las siguientas alternativas [1, 2, 3, 4, 5, 6, 7, 8, ]
